Survey provides insight into who reads nonprofit NJ Spotlight
Knight Foundation recently released the report “Finding a Foothold: How Nonprofit News Ventures Seek Sustainability,” which examined the operations of 18 nonprofit news organizations. John Mooney is founding editor and education writer at NJ Spotlight, one of the organizations featured in the report. Below, he writes about using surveys to learn more about readers. Photo credit: Amanda Murphy.
It’s a dilemma of any online news site: not just how many people are reading you, but who are they? The various analytics tools provide the numbers, but they offer little about the interests, the demographics and the reasons they have come to your pages.
NJ Spotlight endeavored to get to the faces and minds behind the numbers in a survey that aimed to provide a range of information about our most loyal readers. It was a useful exercise, giving us information that helped drive both our content and our business, but it also proved to have its limits and plenty of cautionary lessons.

RELATED REPORT
We conducted the survey in 2012, two years after we launched as a policy news site in New Jersey. We sent it to 500 of our subscribers to ask them who they were and why they came to NJ Spotlight. Almost 300 responded, and we gleaned information from them about their experience with our site, including how often they share our stories and their participation in our public roundtable forums. And we asked them plenty about their own backgrounds, including their jobs, education and income.
One of the most important findings was the education level of our readers; 95 percent of the people who responded to the survey were college graduates, and a majority of those held advanced degrees. The annual income levels were impressive, too, with a third making $150,000 or more. In terms of engagement, one of the most valuable findings was that nearly nine in 10 readers in the sample said they had forwarded one of our stories to another person.
All of that told us we were dealing with a highly educated readership, reinforcing our focus on providing sophisticated information and content to our audience. The fact that a third of our readers were in education careers was important in continuing our emphasis on education in our coverage. The engagement was important, too, telling us that our content was informing our readers and providing them ways to inform others.
The results of the survey proved an especially powerful marketing tool and helped our publisher sell sponsorships and advertising on our site as ways to reach a highly informed and engaged readership. As a small site, we often struggle to market the size of our readership. With this data, we were able to instead market the quality and importance of that readership, and it ultimately became the basis of our media kit, which further highlighted the education and engagement levels. We emphasized that 95 percent of our sampled readers were college-educated, and a third earned $150,000 a year. Does that specifically bring in new sponsors or advertisers? We can’t be sure, but we sent the message that our readers are clearly educated and have means.
But there were limits to the survey and its findings. The survey’s questions left some room for improvement, including in some rudimentary ways. For example, our questions about income were far too broad. Our survey lumped together incomes between $50,000 and $150,000, a very wide swath. In the future, we would break that up into two, maybe even three, separate groupings. In addition, we did not explore social media habits at all, missing out on obtaining insights to an increasingly powerful medium for sharing stories and receiving information. It was definitely a lesson in the need to think through the questions so as to provide information that is specific and usable.
Our hope is to next conduct a “meta” survey—including the possibility of focus groups—that will dig deeper into the reasons people come to our site and what they do with the information. We want more than just demographics but what our publisher calls the psycho-graphics.
Are our readers actual policymakers and stakeholders affecting policy, and is our content providing them important information or an accountability not available elsewhere? Fundamentally, is our content making a difference? It’s a question our funders often ask, and one that additional surveys will help us determine beyond the purely anecdotal evidence.
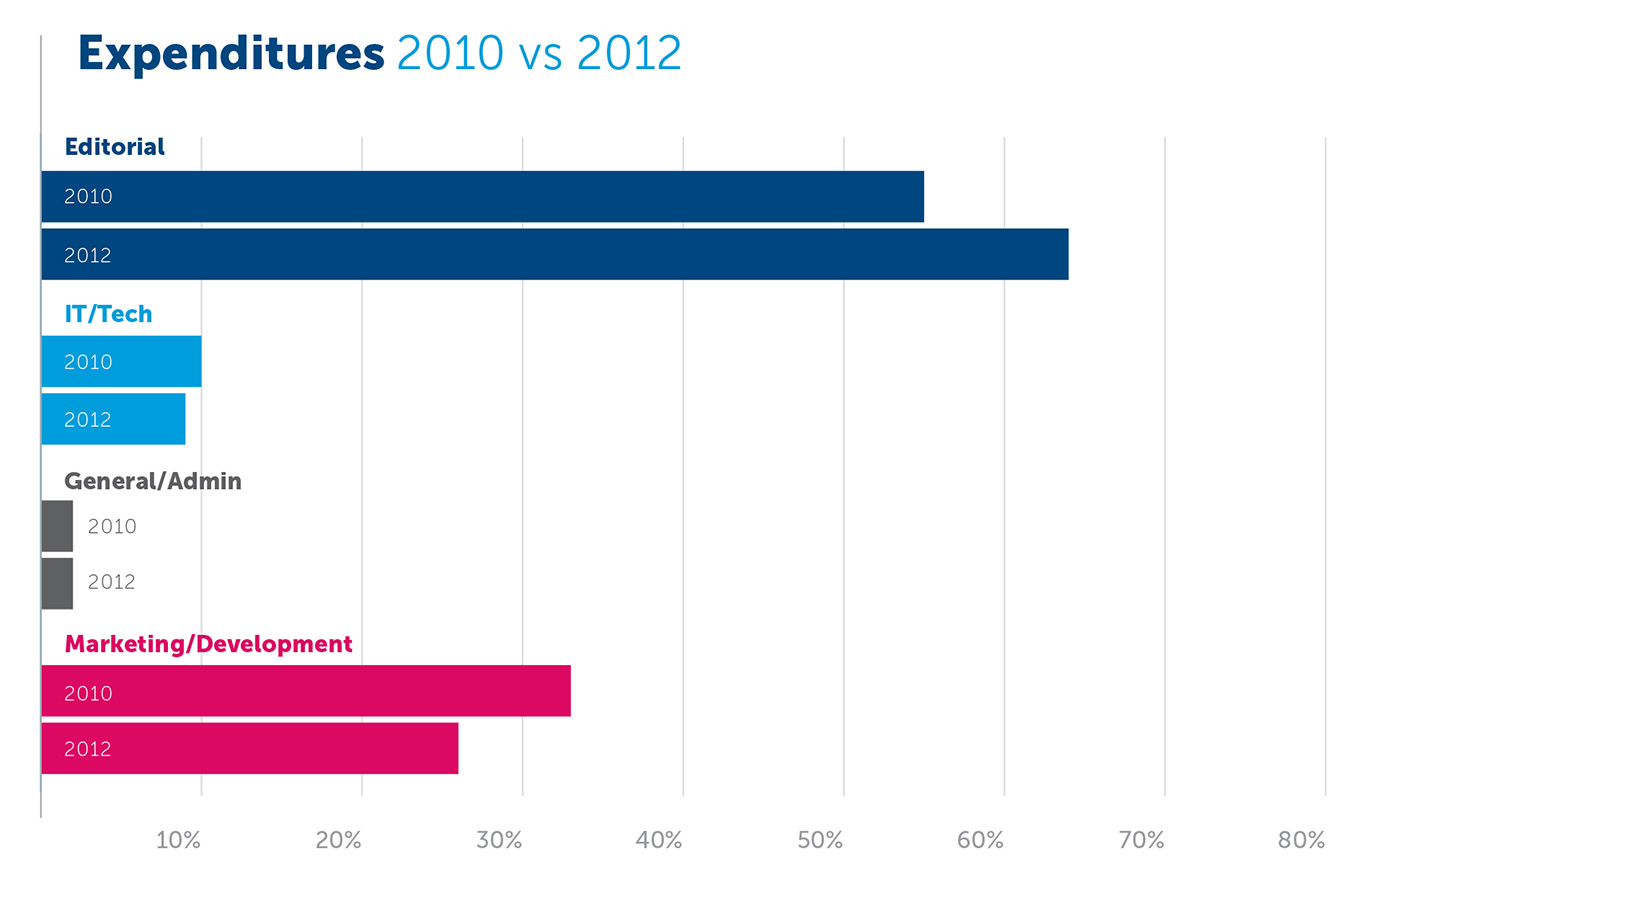
Below: NJ Spotlight’s Expenditures 2010 vs. 2012

Recent Content
-
 Journalismarticle ·
 -
 Journalismarticle ·
 -
 Journalismarticle ·